Since commencement of this plan, the BuildBPS management team has stated its commitment to engaging the community and deciding, together, a best path forward for BPS. In support of this objective, the team began meeting to discuss how best to share the substantial amount of data made available by the assessment effort.
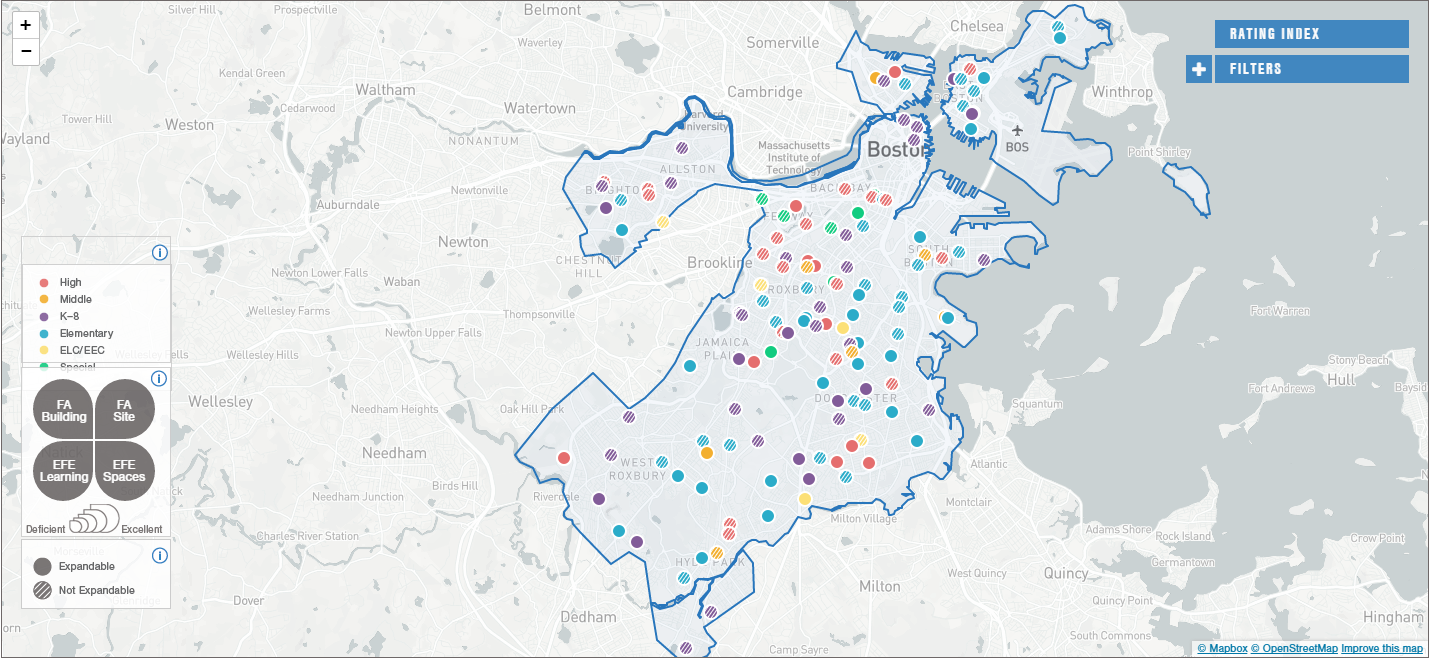
In line with Mayor Walsh’s vision for analytics and the leveraging of data, the concept of a data dashboard was introduced by Symmes, Maini & McKee Associates (SMMA) to encompass all building reports, digital assets, and various data visualizations. The BuildBPS Dashboard, housed on a web-based platform, provides the community with a complete overview of the district (during the 2015–16 school year), along with individual school data. Analysis tools and data visualizations also offer insight into the conditions of school buildings and educational environments, helping users more fully understand the relationships that BPS buildings have with one another and the City in general. The BuildBPS Dashboard is built to allow for the continuous updating of data.